
Weather with Beauty
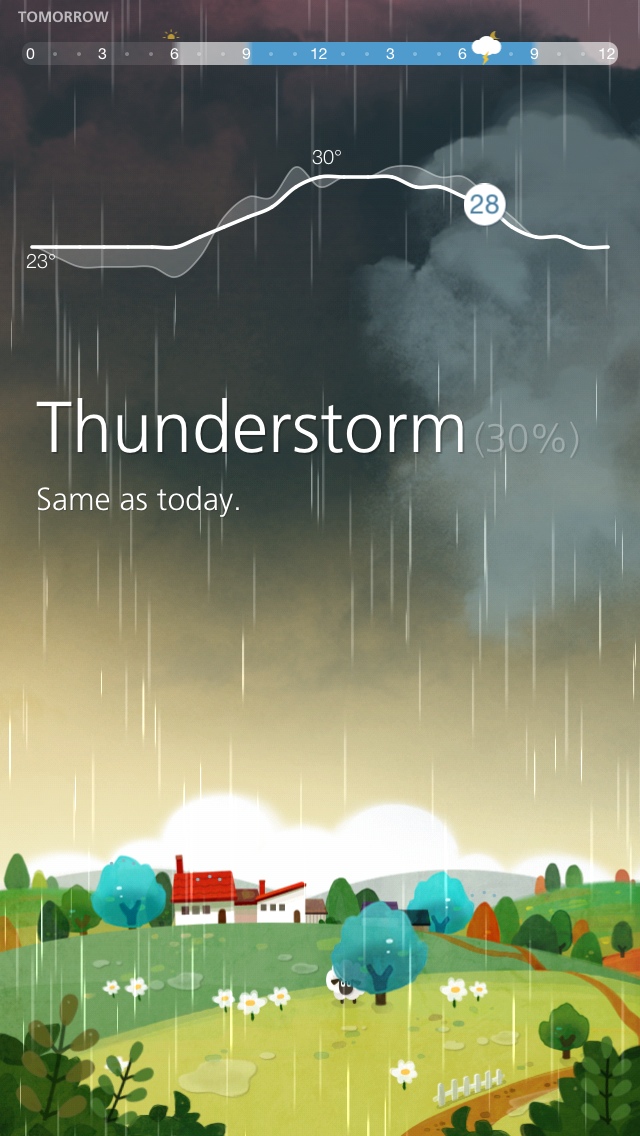
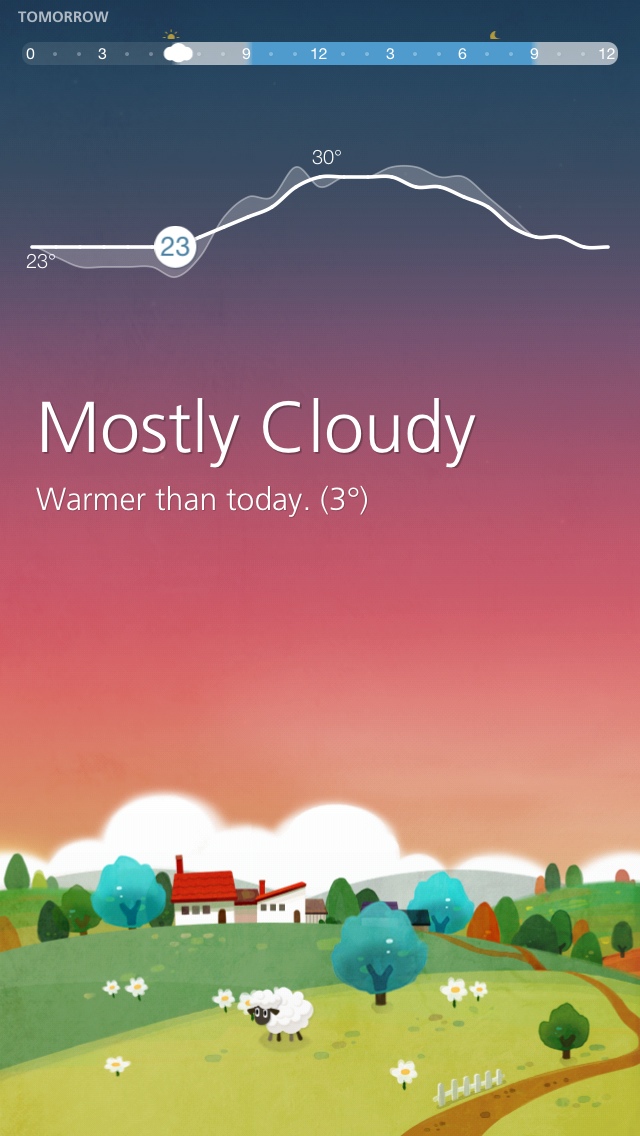
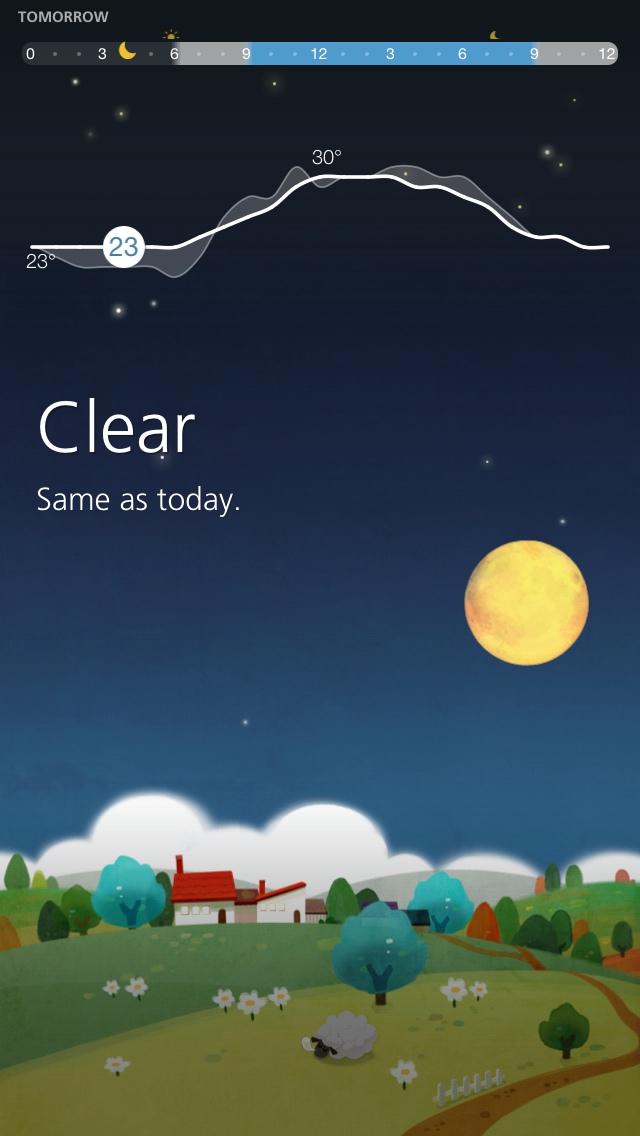
Beautiful live-animation scenes play across your screen in correspondence with the actual weather for your location. The rise and fall of the sun, the many phases of the moon, the color of the skies changing at sunset, how thick the clouds are, how fast the wind blows, and whether there is rain or snow or a thunderstorm; all these elements of weather make unique, picturesque scenes. It's a one-of-a-kind weather display, rather than run-of-the-mill ready-made abstract icons or photo-realistic images.
Watch the scenes change dynamically as you swipe horizontally to navigate the timeline.
Functional Infographics
Intuitive Graph for Comparing Temperatures
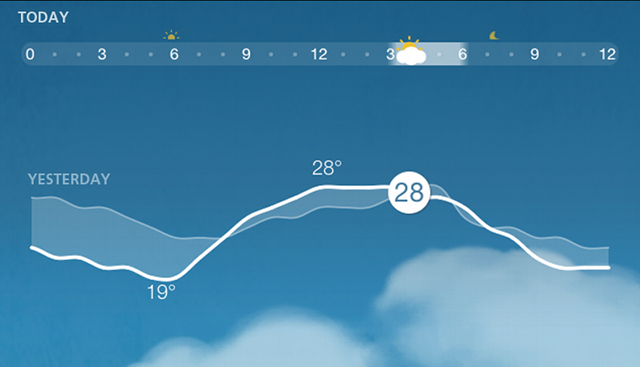
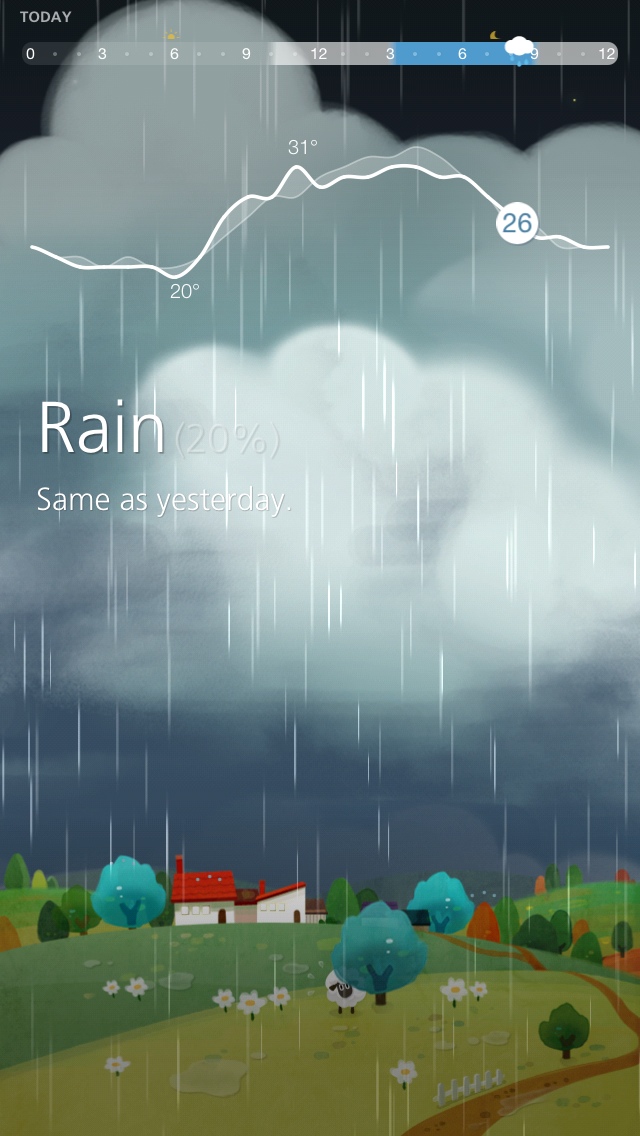
Today's temperature is displayed alongside yesterday's for an hour-by-hour comparison. The visual gap lets you intuitively perceive the difference better than a simple display of digits. The graph starts at midnight, showing you how the temperature will change relative to the temperature you've already experienced through the day.
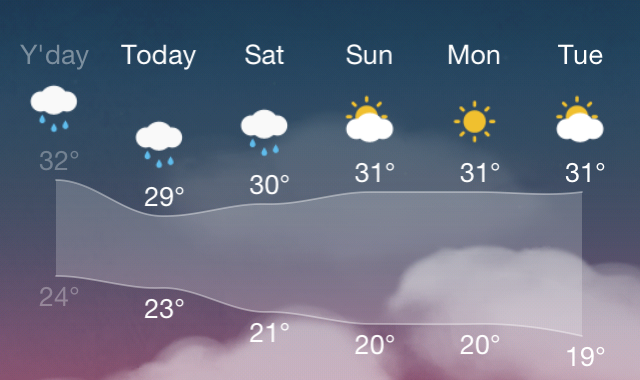
The 5-day forecast also provides yesterday's high/low temperatures for reference.
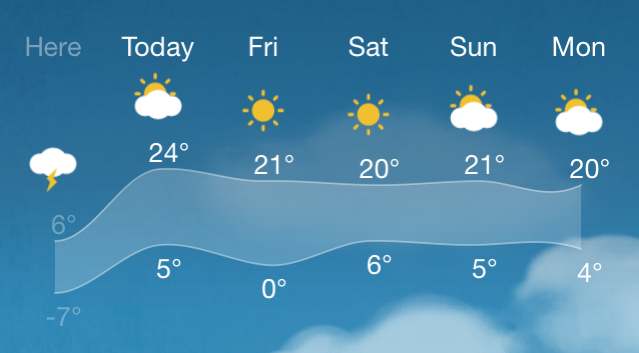
When you track weather in different locations, temperatures are shown in comparison with your current location. If you are planning to go abroad, you can see how hot or cold they are via graph, not by reading numbers.
Simple 3-Color Coded Weather Conditions
The weather condition graph uses three different colors to allow easy viewing of sky conditions at a glance, while swiping horizontally on the timeline brings up details.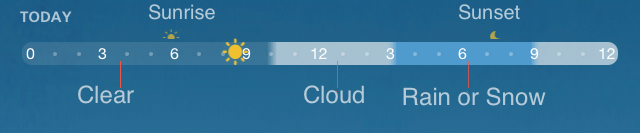
- Transparent - Clear
- White Translucent - Cloudy
- Blue - Rain or Snow
0 to 24 whole day timeline
The fixed-day timeline allows you to check specific times for when weather conditions matter to you, usually routine hours such as commuting times or lunch break.
If you have any further questions or require further assistance, please contact us pxdlabs@gmail.com.